| SEP 30-Day All Cause Readmissions |
| THHBP Monthly Rates Ages 65 and older |
| SEP 30-Day All Cause Readmissions |
| THHBP Monthly Rates Ages 65 and older |
| Fiscal Year | FYTD | July | August | September | October | November | December | January | February | March | April | May | June |
|---|---|---|---|---|---|---|---|---|---|---|---|---|---|
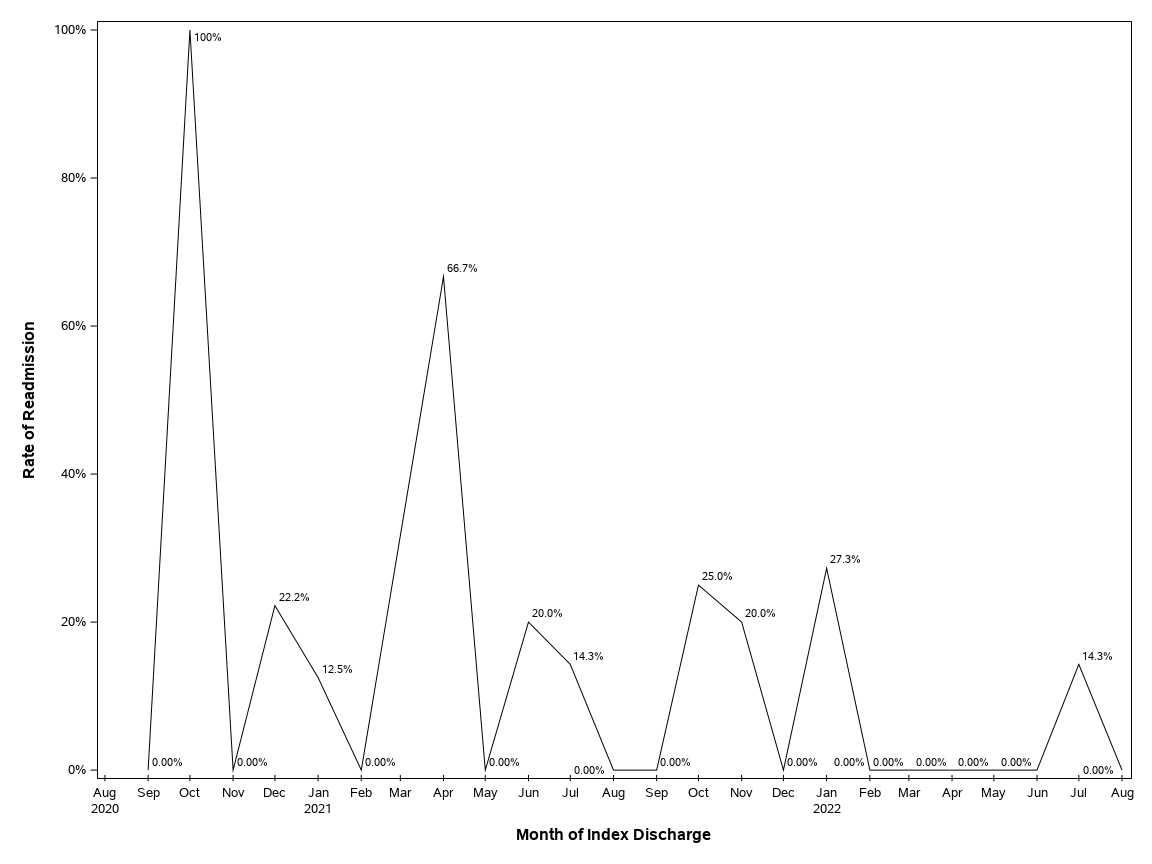
| FY2021 | 19.6% (9/46) |
25.0% (2/8) |
(0/0) |
0.00% (0/1) |
100% (1/1) |
0.00% (0/3) |
22.2% (2/9) |
12.5% (1/8) |
0.00% (0/3) |
(0/0) |
66.7% (2/3) |
0.00% (0/5) |
20.0% (1/5) |
| FY2022 | 9.72% (7/72) |
14.3% (1/7) |
0.00% (0/4) |
0.00% (0/9) |
25.0% (2/8) |
20.0% (1/5) |
0.00% (0/4) |
27.3% (3/11) |
0.00% (0/3) |
0.00% (0/3) |
0.00% (0/9) |
0.00% (0/7) |
0.00% (0/2) |
| FY2023 | 10.0% (1/10) |
14.3% (1/7) |
0.00% (0/3) |
| Patient List - Most Recent 3 Months |
| Medical Record Number | BSWQA Member |
EPIC CSN ID | Index Account Number | Index Discharge Date |
Readmission Date | Readmitting Facility |
Days Between Index and Readmission |
|---|---|---|---|---|---|---|---|
| 8403541 | 0 | . | 65000416202 | 08JUL2022 | 22JUL2022 | THHBP | 14 |
Twenty-Four Month Readmission Detail File - All Ages: Twenty-Four Month Readmission Detail File - All Ages |
Dashboard Last Updated: August 15, 2022 |